Perhaps, it will be apt to describe the joy that greeted the news that Nigeria’s economy is almost twice the previous estimates as that of a hunchback who is healed of his deformity. Yes, he should be happy – at least he can now claim his rightful place BUT “does being taller amount to being better?”
We seek to analyse in this report the current structure of the economy and also undertake comparative analysis of Nigeria vs. other similarly-sized economies (Taiwan, Belgium, Norway and Poland). We also examine the impact of the revised GDP estimates on key dependent ratios (such as GDP per capita, total loans to GDP, fiscal deficit to GDP, trade to GDP, tax to GDP, among others) vis-a-vis the country’s peers and the impact on foreign investors’ perception of Nigeria. Lastly, we analyse the possible policy implications of this new reality.
Changing structure of the economy… the new reality:
Perhaps, the most imposing revelations emerging from the rebasing result is the fact that the structure of the Nigerian economy is changing. The economy is now shown to be driven largely by the services sector, which accounts for 53 percent of the GDP (vs. 29% pre-rebasing). Agriculture now accounts for 22 percent (rather than 39%) while the share of industry slipped to 25 percent from 36 percent pre -rebasing.

Nigerian economic structure vs. other economies with similar sizes
With the new GDP figures, Nigeria now ranks in the class of economies of Belgium, Norway, Poland and Taiwan. We highlight key events in these economies compared with Nigeria as a way of assessing Nigeria’s new found status.
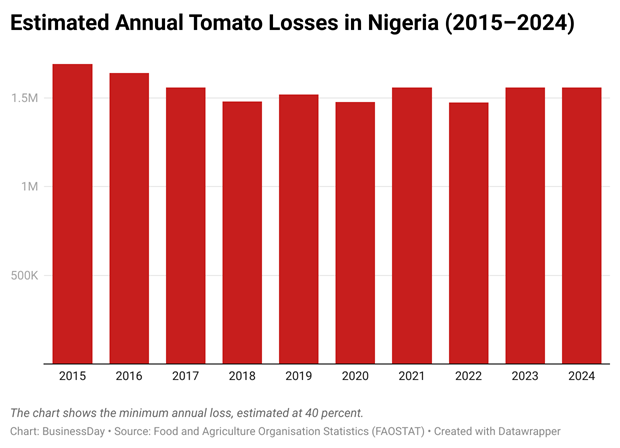
It is important to note that though agricultural contribution to these economies is less than 5 percent, these countries have well mechanised agricultural systems able to meet the demand of their population and export, while Nigeria by contrast remains largely driven by agriculture with 22 percent contribution to GDP (>80% crop production), which remains highly un-mechanised, food security remains a challenge (1.4m children still face severe food insecurity, according to FAO).
Also, Nigeria now appears to rank almost at par with these markets in terms of industry (25% vs. 30%.53% peer average), a clear review of the performance of these economies show that they have all been able to initiate policy reforms that have transformed their economies within the last two decades (case in point Poland and Taiwan).
However, Nigeria remains largely behind in reality if by level of employment alone (23.6% vs. 8.8% peer average).

The country’s economy is expected to do better than it has done if it can improve its road and rail infrastructure, business environment, rigid labour code, commercial court system, government red tape and burdensome tax system.
New debt to GDP – more room for government borrowing
The lower debt to GDP of 11 percent post-rebasing and re-benchmarking leaves Nigeria well below both the World Bank/IMF recommended threshold of 56 percent and FGN benchmark of 40 percent, which leaves the government with an immense amount of space to borrow to drive national development through infrastructure development.
Nigerian tax revenue as a % of GDP cut short by GDP rebasing
Prior to the GDP rebase, tax revenue’s contribution to GDP stood at 20 percent (2% lesser than the target) with a larger proportion contributed by the oil sector. The rebasing exercise however put a lower figure of 12 percent contribution from tax revenue to GDP, implying the wide gap as to the extent to which Federal Inland Revenue Service (FIRS) is able to generate revenue to government coffer.
When compared with the BRICS countries and some other African countries, tax revenue as a percentage of GDP in 2012 shows that Nigerian tax revenue only amounted to 2.74 percent to GDP, while in countries such as South Africa, Kenya and Egypt the ratio stood at 26 percent, 20 percent and 13 percent, respectively.
Even though statistics from FIRS shows that actual revenue generated from tax has always exceeded its target since 2000, save for 2006, when there was a shortfall of 39 percent (N3054.1bn target vs. N1866.2bn actual) and 26 percent deficit in January 2014 (N372.42bn target vs. N346.5bn actual), the fact that tax evasion and tax avoidance are high in Nigeria cannot be erased.
Fiscal deficit to GDP
As provided in Fiscal Responsibility Act, 2007 (a parliamentary document that limits deficit financing for a fiscal year), fiscal deficit to GDP (FD/GDP) in every fiscal year should not exceed 3 percent. While this threshold over the past years has been religiously adhered to (e.g FD/GDP 2012: 2.45%, 2013: 1.85% and e.2014: 1.90%), the rebased GDP has shrunk this ratio leaving more room for government borrowing.
By our estimates, given the budget deficit provision of N0.912trn for 2014 fiscal year at an estimated 1.90 percent fiscal deficit to GDP ratio, with the new GDP figure of N80.22 trillion, our estimate puts current fiscal deficit at 1.14 percent. This implies that even if the target of 1.9 percent FD/GDP is to be achieved for 2014FY, the government has the room to borrow N1.524 trillion, implying N0.612 trillion additional room for debt against the budget provision of N0.912 trillion.
If we assume that more allowance for borrowing will translate to developmental projects, then, it means the rebased GDP will translate into better infrastructure.
Higher base smothers insurance penetration
Insurance, which is usually seen as the runt of the financial services sector, was struck further as the rebasing exercise decreased 2012 insurance penetration to 0.33 percent from 0.58 percent pre-rebasing. The higher GDP base makes it increasingly harder for NAICOM to achieve its purpose of increasing insurance penetration and density in the country.
This however opens up an opportunity for insurance companies and the Commission to employ innovative measures to improve consumer awareness about insurance and thus generate more premiums.
Banking penetration in Nigeria much less than anticipated
Credit to the private sector to GDP as a measure of bank penetration was 21 percent before the GDP was rebased. The new figure at 12 percent, which is a truer representation of the level of the banking industry’s loan book relative to the economy, shows the widening gap between it and its peers like Kenya and Egypt which are 37 percent and 29 percent, respectively.
This shows that there is even more potential for growth in the banking sector than was earlier anticipated. Nigerian banks are set for expansion into the retail market in order to shore up more deposits in order to increase credit allocations and with the demographic profile, this growth aspiration is feasible especially with the employment of technological advancements like mobile and internet banking.
Rebased GDP undermines the status of Nigerian equities market
In most financial markets, equities market capitalisation to GDP is a metric usually employed to assess the spate of development of a financial market. Pre-rebasing, equities market cap to GDP was 21 percent while post rebasing exercise, the ratio has dropped to c.15 percent. This largely suggests the extent of sophistication of our market relative to other emerging and developed financial markets.
Some countries in Africa such as S/Africa (159%), Mauritius (68%), and Kenya (36%), among others, have higher market cap to GDP than Nigeria.
In our view, the current situation is not unconnected with the shallowness of our market. The regulators’ efforts are in top gear to further deepen the market via introduction of more securities and new listings.
We think the rebasing suggests that the NSE authority may be farther to the “promised land.”