Nigeria paint manufacturers – Chemical and Allied Products (CAP) Plc, Berger Plc, and Meyer Plc collectively posted a net profit of N8.3 billion, a 72 percent increase from the N4.7 billion in 2024.
On the surface, CAP appears to have outpaced its competitors in terms of sheer size, generating N44.8 billion in revenue, compared to Berger’s N12.9 billion and Meyer’s N4.23 billion.
However, CAP stands out as the most profitable paint producer. Berger offers a compelling argument for investors looking for value.
When evaluating financial performance, it goes beyond revenue figures. A comprehensive comparison must consider profitability, liquidity, efficiency, and valuation metrics to determine which company delivered stronger results.

Profitability Metrics
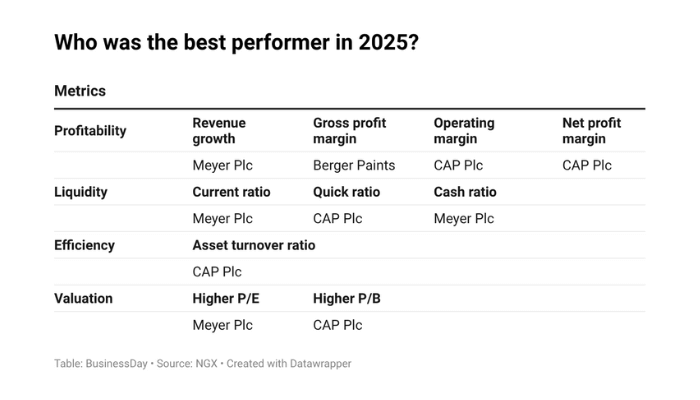
CAP’s revenue surged 23.55 percent in 2025 to N44.8 billion, up from N36.3 billion the previous year. Berger Paints followed with a 19.4 percent increase in revenue to N12.9 billion. However, Meyer Plc led in revenue growth, posting a 35.58 percent increase to N4.23 billion, up from N3.12 billion.
Despite Meyer’s revenue growth, CAP remained dominant in profitability. It recorded a gross profit of N19.4 billion, achieving a 43.3 percent gross margin. Berger followed with N5.7 billion in gross profit and a 44.2 percent margin, while Meyer trailed with N1.5 billion and a 35.4 percent margin.
In operating profit, CAP led with N8.04 billion and an 18 percent margin, outpacing Berger’s N2.2 billion (17.2 percent) and Meyer’s N391 million (9.24 percent). Net profit figures showed both CAP and Meyer posted a 13 percent net margin, while Berger reported an 11 percent net margin with N1.48 billion in net profit.
For Return on Assets (RoA), which shows how effectively a company uses its total assets to generate profit. Analysis by BusinessDay revealed that CAP led with 40.9 percent, followed by Berger Paints and Meyer at 27 percent each.

However, Return on Equity (RoE), which measures how efficiently a company generates profit from the money shareholders have invested, tells a more interesting story about these paint makers.
CAP generated an ROE of 65 percent, which means the company generated N65 in profit for every N100 of shareholders’ equity during the period.
While Berger and Meyer generated over 40 percent for every N100 of its shareholders’ equity.
Based on the assessed profitability metrics, CAP emerged as the most profitable cement producer in 2025.
Read also: Why logistics firms benefit most from cement industry boom
Liquidity Metrics
In terms of liquidity, CAP holds a significant advantage over Berger and Meyer Plc across all key ratios.
Analysing the paint makers’ current ratio, CAP, and Meyer has N2 in short-term assets for every ₦1 it owes in the short term, a sign of strong liquidity, while Berger has N1 in its short-term assets.
In the quick test ratio, CAP reported a 20.2 times capacity, meaning that it can cover its short-term debts 20.2 times without selling inventory.
This is a different story for Berger and Meyer, as they will take 5.04 and 2.57 times to cover their short-term debts without selling inventory.
For the firm’s ability to cover its short-term debt with its cash flow, Meyer Plc emerged as the strongest on immediate cash cover, posting a cash ratio of 2.46 times, indicating it held more than twice the cash required to settle its short-term obligations.
CAP Plc also maintained a comfortable liquidity buffer, with its cash ratio improving to 1.38 times as cash balances climbed to N11.7 billion, outpacing growth in current liabilities.
In contrast, Berger Paints remained below the safety threshold, recording a cash ratio of 0.64 times, suggesting it could only meet about 64 percent of its short-term commitments with available cash, despite a notable increase in cash holdings during the year.
With stronger short-term liquidity, CAP is better positioned to meet its financial obligations without relying on asset sales, while Meyer has liquidity to meet its short-term obligations, particularly in terms of cash availability.
Efficiency Metrics
Operational efficiency improved across the three firms in 2025, with CAP Plc leading asset utilisation within the sector, recording an asset turnover of 1.82 times, reflecting strong revenue growth to N44.85 billion relative to its asset base of N24.7 billion, suggesting the company generated nearly N1.82 in sales for every naira invested in assets.
Berger Paints followed with a turnover of 1.40 times, supported by higher sales of N12.9 billion, though asset expansion moderated overall efficiency gains. Meyer Plc posted the lowest ratio at 1.23 times, indicating comparatively weaker asset productivity despite improved revenues.
Overall, the figures point to CAP Plc as the most efficient operator in converting assets into revenue during the year under review.
Read also: Airtel Africa mobile money IPO listing on track as transaction hits $210bn
Valuation Metrics
Valuation metrics across the three paint manufacturers point to elevated investor expectations in 2025, underpinned by strong earnings growth and improved operating performance.
Meyer Plc commanded a rich earnings multiple of 116.7 times price-to-earnings (P/E), the highest among its peers despite its smaller scale, indicating speculative confidence in future growth prospects, although its price-to-book (P/B) ratio of 3.1 times remained lower than CAP’s.
Berger Paints appeared relatively cheaper on an earnings basis with a P/E of 93.8 times, yet its high P/B multiple of 2.8 times still pointed to strong market confidence. Overall, the stretched valuations suggest the market is pricing in sustained profit momentum across the sector, leaving limited room for earnings disappointments.
CAP Plc, on the other hand, traded at a P/E ratio of 91.9 times and a P/B multiple of 3.9 times, reflecting the market’s willingness to pay a premium for its dominant market position, strong profitability, and superior operational efficiency.
What investors should know?
The analysis of Nigeria’s leading paint manufacturers shows CAP Plc as the strongest performer operationally in 2025, while Berger Paints presents the most attractive entry point on valuation grounds, and Meyer Plc carries a higher risk relative to its current fundamentals.
CAP clearly outperformed peers in revenue scale, margins, asset efficiency, and returns, posting the highest operating profit margin at 18 percent, strong net margins of 13 percent, superior asset turnover of 1.82 times, and leading ROA and ROE levels. Its solid liquidity position further strengthens its financial resilience. However, despite a slight easing in valuation,
CAP still trades at elevated multiples of 91.9 times earnings and 3.9 times book value, suggesting much of its strong performance is already reflected in the share price. This position CAP more as a hold for existing investors rather than a fresh buy.
Berger Paints delivered solid revenue growth, healthy margins, and improved efficiency while trading at relatively lower valuation multiples, with a P/E of 93.8 times and a P/B of 2.8 times. This combination positions Berger as the most attractive buy among the three.
Meyer Plc recorded the fastest revenue growth and strongest cash position but lagged in profitability and efficiency. Its very high P/E of 116.7 times signals stretched valuation, making it a sell for conservative investors despite growth potential.