The result of the GDP rebasing exercise for Nigeria released by the National Bureau of Statistics (NBS) in 2014 confirmed what many had come to suspect – that the structure of the Nigerian economy had changed considerably. Prior to the update of the current GDP to 2010 base-year, many important decisions were being made on the structure suggested by the outdated 1990 base-year, which increased the risk of failure of such decisions, and necessitated the rebasing exercise.
Many people still wonder what the implication of this change in structure portends for opportunities and risk in the different sectors. This is an attempt to create one index that addresses those issues, but to get to that index, four individual indices had to be created. There are a number of indicators that help measure the viability of sectors. These indicators are useful individually, but collectively, they are more formidable as they are complementary in nature. The first is the resilience index which measures the deviation of each sector’s growth from its average over a specific number of years, usually five years. For a sector to be considered viable, it is important for the sector’s growth to be relatively steady, not deviating too much from an established trend. These sectors are usually the last to go into recession, and the first to emerge out of the ruins of general contraction. The resilience score can be applied as a risk measure; the higher the score for a particular sector, the more stable the growth of the sector.

There has been a significant shift in the resilience scores of the different sectors when we compare the old and the new GDP series. Wholesale and retail sector which was out of the top 10 in the old series has emerged the leader in the new series, with a considerable gap between its score and that of the next sector.
Telecoms, construction, crop production and human health and social services are other notable sectors that have emerged in the top 10 resilience chart that were absent in the old series. Oil refining, accommodation and food services are some of the key sectors that have receded in resilience, and now occupy the bottom 10 of the chart in the new series, from their enviable positions in the top 10 of the old series. The implication of this is that the growth of these sectors have become more volatile, which suggests higher risk.
The resilience index is followed by the sector size index, which measures the relative size of the different sectors. The nominal size of sector speaks to the size of the opportunity within that sector, and the importance of size to the viability of a sector cannot be overemphasized. A key attribute of the sector size index of the new GDP series is its relatively more even distribution compared to the old GDP series. The sector size scores in the old series was heavily skewed in favour of the crude petroleum and crop production, which accounted for about 67 percent of the total scores, with the gap between the second and third sector almost 15 points.
Again, the telecoms sector has found its way into the top 5 of the new GDP series, after occupying 11th position in the old series. While crop production, wholesale and retail trade, and crude petroleum sectors have shed considerable points, telecoms has increased by almost tenfold. This is an indication of a sector that has grown in importance between the old and the new dispensation.
The next equally important indicator is the sector growth index which measures the relative growth of the different sectors. Applying this measure on its own has its drawbacks, particularly due to the base effect, which suggests a smaller sector will likely grow at a faster rate than its much larger counterpart. Although quick pace of growth is desirable, but if the sector is small in size, then the opportunities will be limited to the current size of the sector. It is, however, a good indicator to watch out for when the interest is in the emerging sectors.

The new sectors dominate the sector growth index of the new GDP series, which supports the notion of the importance of the index in capturing emerging sectors. Only accommodation and food services sector features in the top 10 of both the old and the new series. The most notable drop is the crude petroleum and natural gas which has gone from the second on the chart in the old series to the last in the new series. We see the emergence of new sectors such as plastic and rubber products, arts, entertainment and recreation, chemical and pharmaceutical products, basic metal, iron and steel, and textile, apparel and footwear in the top 5 of the new series.
The emergence of these new sectors at the top of the growth index is indicative of the gradually changing consumption pattern from basic needs to discretionary spending, as many of them are lifestyle sectors.
The last individual index is the sector growth contribution index. This indicator measures the relative contribution of each sector to the total growth in the aggregate economy. The absolute size of the contribution of each sector is indicative of the size of the new opportunities created in the sectors annually. This is key to success when deciding whether to invest in a sector or lend to the sector. This index is the flip side of the sector growth index, as it considers the absolute contribution rather than just the growth of the sector.
The sector growth contribution index for the new series is more evenly distributed than that of the old series, with the telecoms sector again upstaging a number of sectors to climb to the top 5 in the new GDP series. The food, beverage and tobacco, professional, scientific and tech, and textile, apparel and footwear are newly created sectors that feature in the top 10 of the new GDP series.
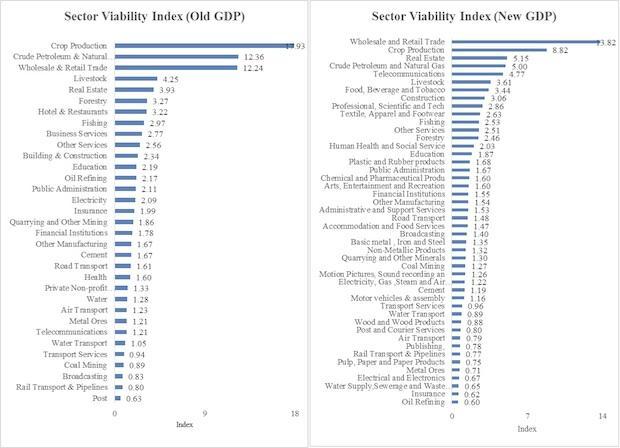
As useful as all the above-described indicators are individually, each has a specific bias. This was the motivation behind the design of an aggregate index that encapsulates all the attributes of the individual indicators, without the individual biases. The sector viability index is an equal weighted index, calculated annually, that captures the opportunities and risks associated with a sector. It is a tool that can be deployed to aid or validate important decisions regarding sector exposure. As the viability index score increases for a particular sector, so does the attractiveness of the sector.
There has recently been a change in the political administration at the centre, which is likely to engender a change in the political and economic directions. This is expected to have a significant impact on the structure of the Nigerian economy over the next four years. There are many imbalances in the Nigerian economy as presently constituted that need to be corrected, without which the much-desired double-digit economic growth will remain elusive. The revamp of the railway sector is long overdue, so also is the oil refining and power sectors. These sectors will have multiplier effect on the aggregate economy and effectively alter the nature of opportunities and competition in the Nigerian landscape. Now is the time to identify those sectors that will be the main beneficiaries of a stable power supply, functional railway and general ease of doing business. The sector viability index provides the basis for identifying these sectors.
Olugbenga A. Olufeagba